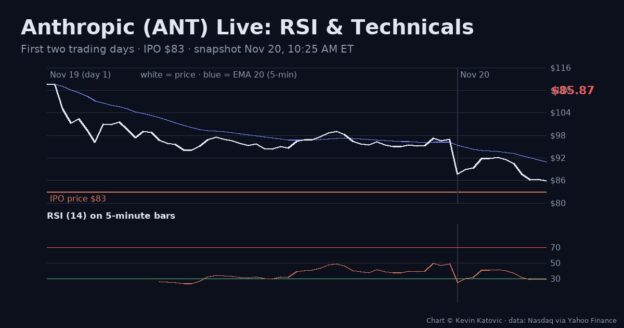
Anthropic (Nasdaq: ANT) is two days old as a public company, and it has already had a wild ride. Below is a live ticker and live chart, followed by every technical indicator we can honestly read on a stock this new, including the RSI for both trading days.
Snapshot numbers in the tables were taken at 10:25 a.m. Eastern on Friday, November 20, 2026. The widgets update live.
Live ANT Ticker
Live ANT Chart With RSI, MACD and VWAP (5-Minute Bars)
Day 1 and Day 2 at a Glance
| Thu Nov 19 (debut) | Fri Nov 20 (to 10:25 a.m. ET) | |
|---|---|---|
| Open | $111.50 (first trade about 11:45 a.m.) | $89.86 |
| High | $113.31 | $92.56 |
| Low | $92.72 | $85.68 |
| Close / last | $97.17 | $85.87 |
| Change | +17.1% vs the $83 IPO price | −11.6% vs Thursday’s close |
| VWAP | about $102 | about $90.25 |
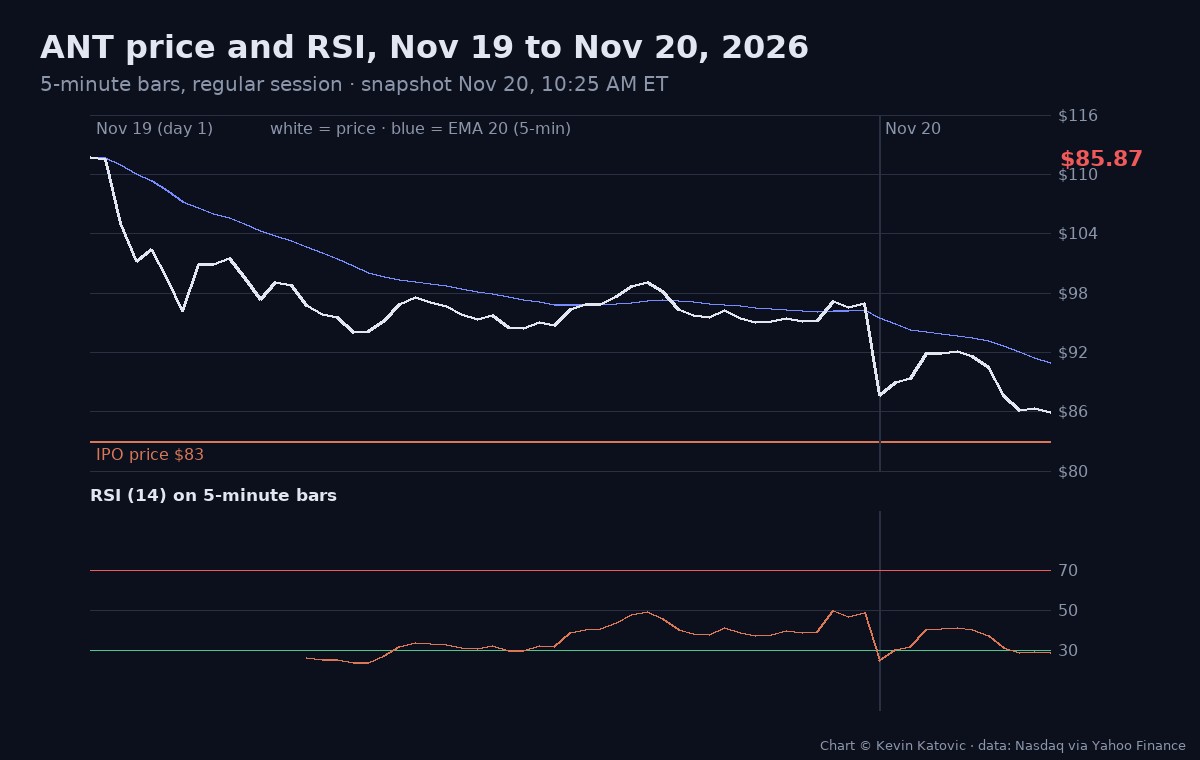
| RSI(14), 5-min, close of session | 48.8 | 28.8 (oversold) |
| RSI(14), 5-min, range | 23.8 to 49.9 | 25.1 to 41.5 |
The short version: buyers paid up to $113 in the first few minutes, sold it down all afternoon to close at $97.17, and then opened Friday another $7 lower. At $85.87 the stock is still about 3.5% above the $83 IPO price, but 24% below Thursday’s high.
RSI for the Past Two Days
The Relative Strength Index measures how strong recent gains are compared with recent losses, on a scale of 0 to 100. Above 70 is usually called overbought, below 30 oversold.
- Thursday, Nov 19: RSI on 5-minute bars dropped into the low 20s within the first hour as the opening pop faded, then spent the afternoon recovering toward 50. It ended the day at 48.8, which is neutral.
- Friday, Nov 20: the lower open sent RSI straight back under 30. As of 10:25 a.m. it reads 28.8 on 5-minute bars, 27.2 on 15-minute bars and 28.9 on 1-minute bars. All three timeframes are oversold at once.
Oversold does not mean “about to bounce”. In a fresh IPO, early sellers (flippers and anyone who got an allocation at $83) can keep RSI pinned low for a while. It does mean the selling has been one-sided and fast, which is when short, sharp relief rallies tend to happen.
All Technicals (Snapshot, 10:25 a.m. ET Nov 20)
| Indicator | 5-minute | 15-minute | Reading |
|---|---|---|---|
| RSI (14) | 28.8 | 27.2 | Oversold |
| MACD (12, 26, 9) | −2.53, signal −1.96 | −3.45, signal −2.63 | Bearish, histogram negative |
| EMA 9 / 20 / 50 | $88.58 / $90.99 / $94.96 | $91.67 / $95.01 / n/a | Price below all, EMAs stacked downward |
| Bollinger Bands (20, 2) | $84.29 to $99.35 | $87.80 to $102.49 | Riding the lower band |
| Stochastic %K (14) | 1.5 | 1.4 | Deeply oversold |
| Williams %R (14) | −98 | −99 | Deeply oversold |
| ATR (14) | $2.00 | $3.93 | High volatility for the price |
| VWAP (today) | $90.25 | Price below VWAP | |
Levels traders are watching: support at the $83 IPO price, which underwriters often defend early on, and resistance at Friday’s VWAP near $90.25, Friday’s high at $92.56, Thursday’s close at $97.17 and Thursday’s VWAP near $102.
Live Technical Rating
This widget summarises oscillators and moving averages live. Switch the tabs for 1-minute through 1-day readings (the daily tab will fill in as ANT builds more history).
Why the Stock Fell on Day 2
Big IPO debuts often follow this shape: a huge opening pop as unfilled orders chase a limited float, then steady selling from investors who got shares at the offer price and take a quick profit. Anthropic sold more shares than planned at $83, and underwriters also hold a 30-day option on up to 147 million more, so there is plenty of supply. The wider tech market has also been weak, with the Nasdaq 100 down about 13% from its early October peak.
For the background on the company itself, see the full timeline of how Anthropic’s IPO was priced and dated and what the filing revealed about that headline $80 billion loss. To compare ANT with the rest of the sector, there is a live board of AI data-center stocks, and a look at how much CoreWeave spends on compute each quarter. Curious what it takes to build the hardware Anthropic runs on? Try the AI Build Configurator.
Frequently Asked Questions
What was Anthropic’s IPO price?
Anthropic priced its IPO at $83 a share, above the marketed $70 to $78 range, and its Class A shares began trading on the Nasdaq Global Select Market under the ticker ANT on November 19, 2026.
How did ANT stock do on its first day?
ANT opened at $111.50 just before noon Eastern on November 19, 34% above the IPO price, touched a high of $113.31, and closed the day at $97.17, a gain of about 17% over the $83 offer price.
What is the RSI of ANT stock right now?
At 10:25 a.m. Eastern on November 20, the 14-period RSI was about 29 on 5-minute bars and about 27 on 15-minute bars, both under the 30 line traders treat as oversold. The live chart on this page updates it in real time.
Why is there no daily RSI for ANT yet?
A 14-day RSI needs at least 15 daily closes. ANT has traded for only two sessions, so for now RSI and the other indicators can only be read on intraday charts such as 5-minute and 15-minute bars.
Not financial advice. This post is for information and entertainment. Indicators on a two-day-old stock are based on very little history and can change quickly. Data: Nasdaq trades via Yahoo Finance; live widgets by TradingView.
Charts in this post are original work by Kevin Katovic. © 2026 Kevin Katovic. All rights reserved.

Pingback: What Is the Pentagon Using Claude For Right Now?